Adobe photo by Nico El Nino.
Policy administrators in India confront complex issues concerning population, health and development and are continually looking for ways to address them. While data is available, a user-friendly resource that has the ability to synthesize, analyze and visualize critical indicators in a geographically granular and policy-relevant manner has not been possible until now.
The recently launched India Policy Insights (IPI) is a comprehensive geovisual online data platform of policy-relevant population health and development indicators derived using novel statistical techniques at multiple geographic levels. IPI is being led by S V Subramanian, Professor of Population Health and Geography at Harvard and is now a collaborative initiative of the Geographic Insights Lab at the Harvard Centre for Population and Development Studies and the Centre for Geographic Analysis at Harvard; NITI Aayog, a policy think tank of the Government of India; and the International Institute for Population Sciences (IIPS)
IPI is guided by the belief that “If you can see a problem, you can solve it.” It aims to guide efficient resource allocation, targeted policy actions and performance monitoring. IPI resources will be open access to the public for any use with appropriate attribution.

S V Subramanian, Professor of Population Health and Geography at Harvard.
What is significant about this partnership with NITI Aayog? How will this expand the influence of the tool?
The new India Policy Insights/NITI partnership will help to strengthen NITI’s evidence-based monitoring capacity by providing a first-ever public online geo-visual data platform that synthesizes and visually analyzes policy indicators related to health, nutrition and population across all districts, Parliamentary constituencies, Assembly constituencies and villages of India. This new tool will be designed to help guide efficient resource allocation and targeted policy actions, enabling NITI’s stakeholders to leverage precision data to design more effective interventions and channel support to the communities showing the most need.
Who is the tool intended for?
The IPI data dashboard will be a fully publicly accessible online platform intended to be used by a range of stakeholders: government civil servants at the national, state and district level; elected officials; citizen groups; public policy advocates; researchers; and journalists, to name a few.
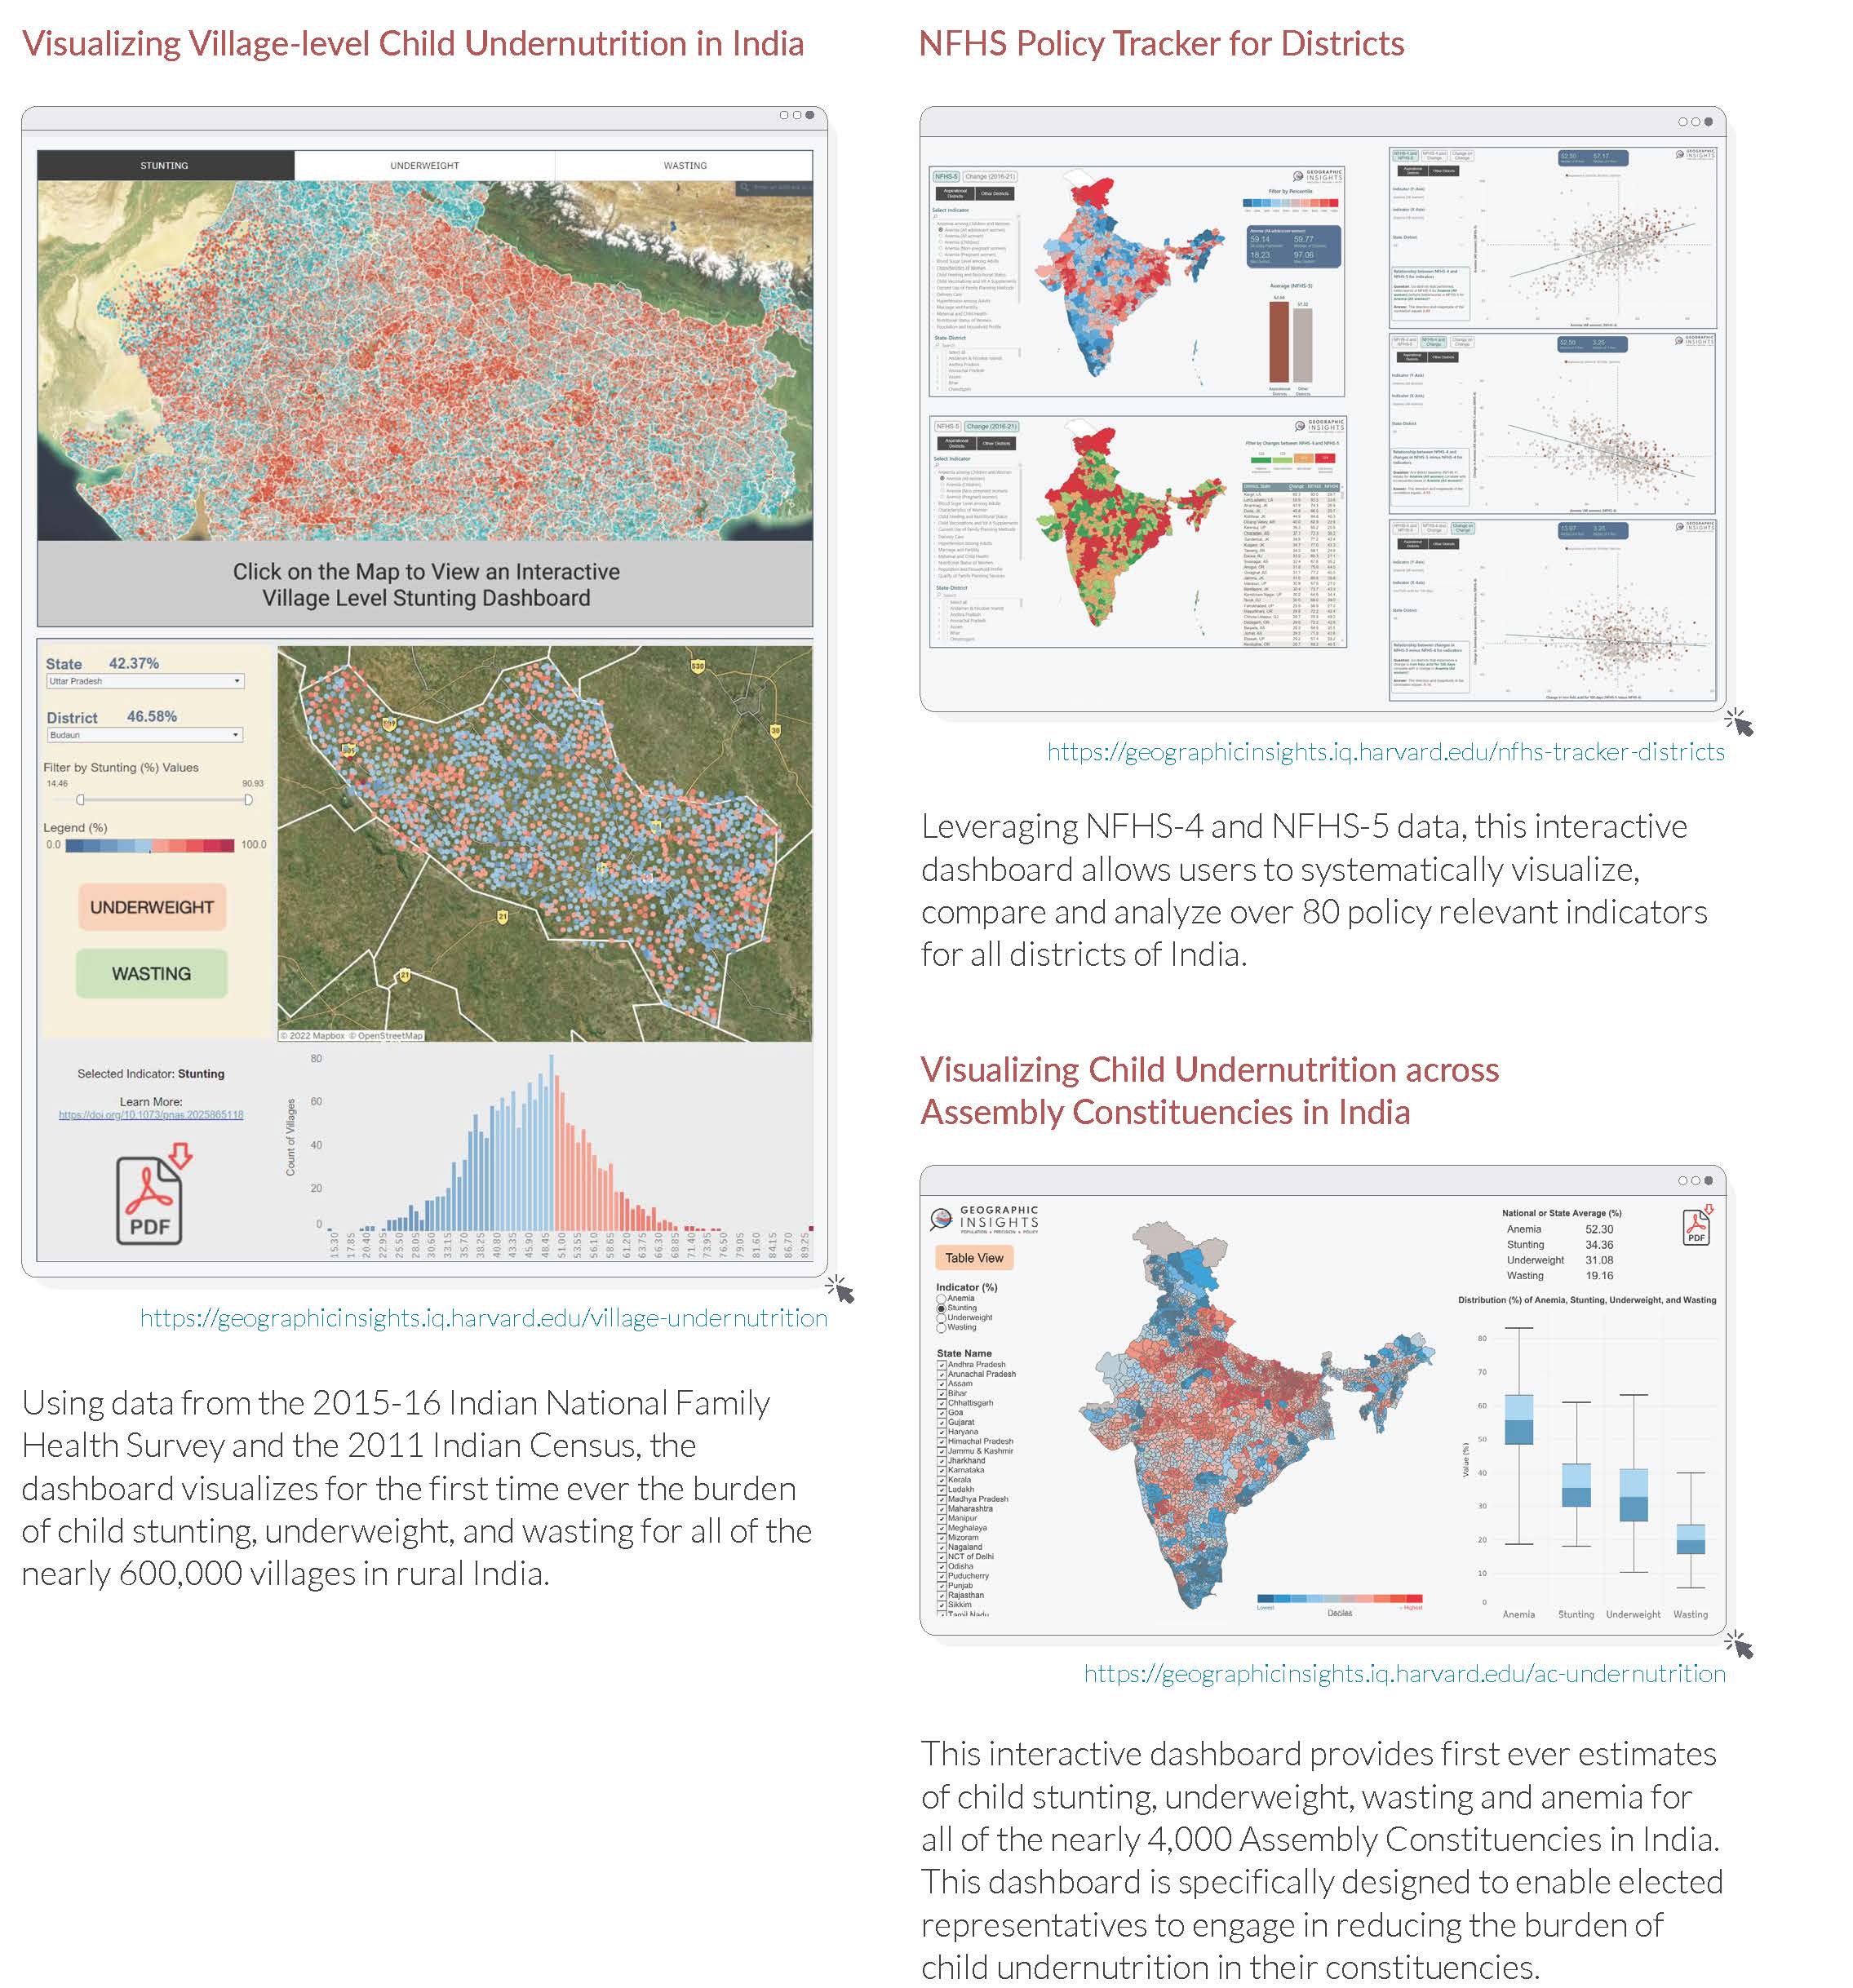
Image Below: Various types of IPI research examples. Visit the Geographic Insights Lab to learn more about the scientific research underpinning the IPI, as well as work in progress geared towards the development of a standalone geovisual open and accessible IPI platform.

How do you hope this tool will be used?
India Policy Insights (IPI) is a collaborative initiative created to:
- Support the Civil Services Officers in India to efficiently learn about the unique issues in their assigned states and districts
- Augment District Magistrates and Collectors and Field Cadre Officers’ decision-making capabilities to identify and prioritize villages under their jurisdiction for implementation of national policies
- Enable policy makers at the Centre and across states in defining current and emerging issues based on a thorough analysis of data
- Empower elected officials to constructively engage with their constituents on individual and local health and well-being concerns
What are some of the key new features?
The latest tool from IPI is the NFHS Policy Tracker for Districts in India. Using the district factsheets from the National Family Health Surveys (NFHS-4 and NFHS-5), users can now visualize and analyze NFHS-5 (2019-21), as well as change between NFHS-4 (2015-16) and NFHS-5 for the districts of India. Users can further filter visualization and analysis by:
- Aspirational Districts
- Survey Phases of NFHS-5
- States/Districts
Additionally, the new Indicator Analysis tool on the Policy Tracker allows you to customize an analysis of more than 80 possible health indicators. It allows users to select any two health indicators for one, multiple, or all Indian states, to view relationships in prevalence across districts (and aspirational districts) and over time.
The three possible queries are:
- the relationship between data from the NFHS-4 and NFHS-5 surveys (a 5-year spread, 2016-2021) for one or two selected indicators
- the relationship between NFHS-4 data in one selection, and change from NFHS-4 to NFHS-5 in the second
- the relationship between change from NFHS-4 to NFHS-5 in both selections
![India Policy Insights Brief_FINAL_10-02-2022[1]_Page_1](https://mittalsouthasiainstitute.harvard.edu/wp-content/uploads/2022/02/India-Policy-Insights-Brief_FINAL_10-02-20221_Page_1.jpg)
Image Above: The comprehensive geovisual online data platform shows policy-relevant population health and development indicators and geographic visualizations and analytics derived using novel statistical techniques at multiple geographic levels. Features include interactive dashboards, policy metrics and geographic visualizations and analytics (above).
What will these new features help decision-makers better understand?
The Policy Tracker tools provide an intuitive, user-friendly interface to quickly query and analyze NFHS-5 and change data for critical indicators across states, districts and aspirational districts, using either the Atlas map view or the Analysis scatterplot visualizations. With this ability to quickly drill down into district indicator data over the 5-year period, insights gained can help policy makers adjust and fine-tune public health interventions to address more localized need as observed in specific states and districts.
What is the potential real-life impact this tool can have in India?
This tool will enable public health stakeholders in India to more accurately evaluate the efficacy of current public health initiatives, such as Poshan Abhiyan, India’s National Nutrition Mission, and pinpoint districts and aspirational districts where more attention is needed. It will also help inform better evidence-based policy dialogue and design for future targeted interventions to direct India’s valuable and finite resources to the communities where the need is most acute.
